Achieving your crowdfunding goal is a major milestone, but it’s just the beginning. Sustained success requires a thorough post-campaign analysis. This article explores the crucial aspects of post-campaign analytics, from understanding backer demographics and evaluating crowdfunding ROI to dissecting social media and web analytics. Learn how to leverage key metrics to refine marketing strategies, optimize conversion rates, and set the stage for long-term success in the world of crowdfunding.
Contents
The importance of post-campaign evaluation in crowdfunding
Reaching your crowdfunding goal is a huge deal! Only 41% of projects launched on Kickstarter get fully funded. If you’ve hit that mark, it’s first and foremost time to celebrate.
But hitting your goal and achieving a certain dollar amount can’t be your only indicators of success.
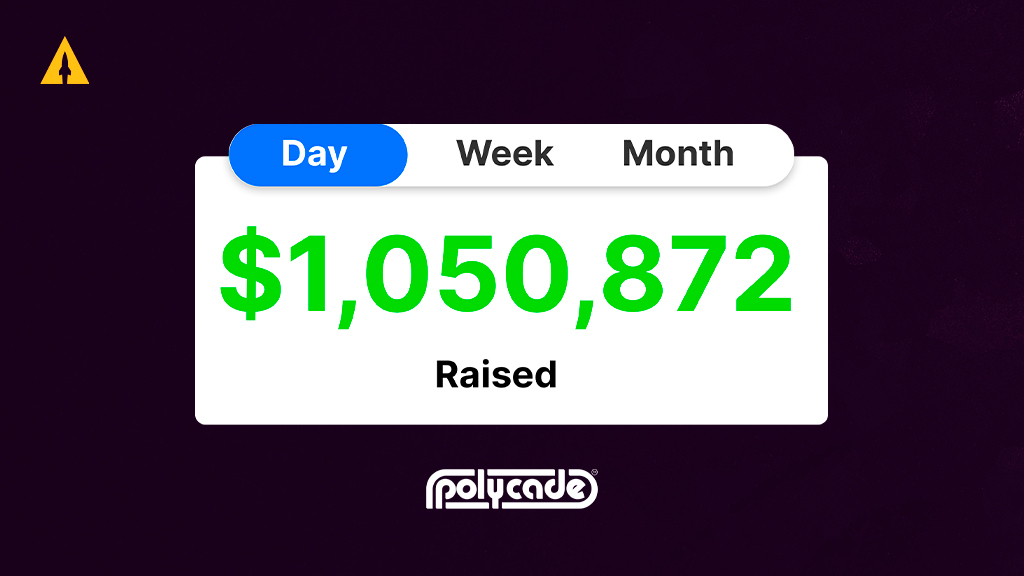
Even raising $1 million on Indiegogo or Kickstarter isn’t the end all be all. Coolest Cooler struggled to stay afloat after raising $13M on Kickstarter. Pebble, one of the most funded Kickstarter campaigns of all time, closed down 3 months after its final multi-million-dollar campaign.
Crowdfunding is only the beginning. There’s a long and winding journey ahead — you’re scaling your business, transitioning to e-commerce, and paving the way for more products and brands.
That’s why a post-campaign evaluation is crucial to the crowdfunding process. The better you understand your business and audience, the better positioned you’ll be for long-term success.
Today, we’ll look at a few key components in post-campaign analytics and crowdfunding data interpretation:
- Analyzing backer data and demographics
- Understanding crowdfunding ROI
- Measuring crowdfunding conversion rates across ad, web, and social media
Key metrics in crowdfunding analysis
A thorough post-campaign analysis will give you a clearer picture of your business and customers.
It helps you figure out who your customers are and what they respond to:
- Which audiences are most likely to buy your product?
- Which product messaging resonates the most with those audiences?
- Which customer acquisition channels are most effective?
The better you can answer these questions, the more prepared you’ll be to scale your business and make the transition to e-commerce.
Understanding backer demographics and behavior
Demographic data like age, gender, location, and interests provide valuable clues about who is most likely to buy your product.
Backer surveys are integral here. A well-designed backer survey will do two things: 1) gather demographic information on who your audience is, and 2) encourage feedback and suggestions for improving your product.
Backer analytics hugely informs your marketing direction post-campaign. It guides pricing and reward strategies for future crowdfunding efforts. And it inspires new ideas and product refinements, ensuring your final product will meet and exceed backer expectations.
Another useful tool for analyzing backer demographics and behavior is Google Analytics. Google Analytics tracks how long users stay on your page and how many make a purchase. It also keeps tabs on your different marketing channels so you can measure the effectiveness of each one.
For example, we used Google Analytics during our DMOS Alpha Shovel campaign, which raised $177,496 on Kickstarter.
To put the Alpha Shovel in front of more audiences, we ran cross-promotions with other Kickstarter campaigns. We then used Google Analytics to track exactly how much traffic, activity, and revenue we generated specifically from these cross-promotions.
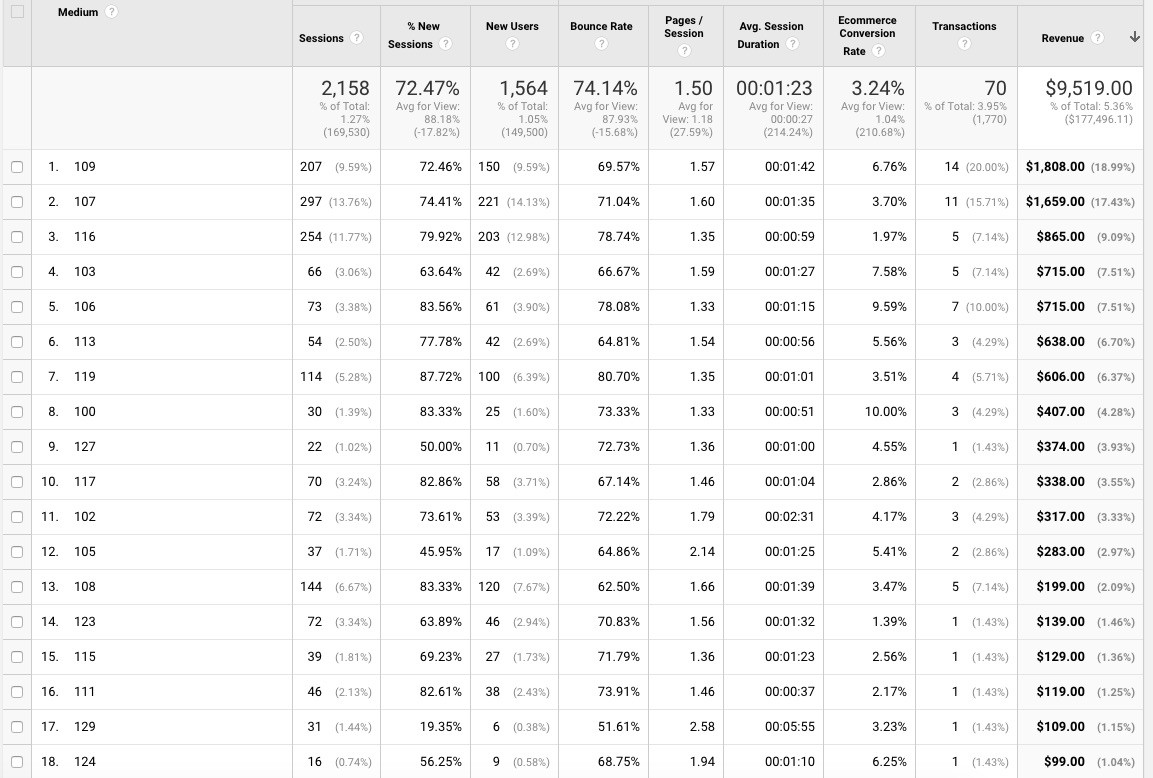
You can see from our dashboard that our cross-promotions raised $9,519, which is 5.3% of our total revenue.
Take a look at your different marketing channels. Which generated the most traffic? Which contributed the most revenue? Understanding where your backers are coming from will help you hone in on your target market going forward.
Financial metrics: Understanding crowdfunding ROI
Your return on investment (ROI) reflects how much your campaign is growing per dollar spent, while your return on ad spend (ROAS) reflects how much each dollar you spend on advertising directly raises for your campaign.
But here’s the thing about crowdfunding ROI. Very few campaigns make a lot of profit. With a crowdfunding campaign (or any product launch for that matter), you’re incurring substantial startup costs to get your idea off the ground.
You need to think about your business beyond your campaign. Profitability is not the goal – instead, proving you can acquire a customer profitably is.
Your campaign doesn’t need to be extremely profitable. Your funding goal should cover the minimum amount required to create your product. With crowdfunding, you’re looking to acquire customers profitably, validate that there is a market for your product, and set the stage for e-commerce.
So how do ROI and ROAS help with that?
Knowing your ROI and ROAS lets you isolate the most successful and least successful components of your campaign.
For example, eWheels V2 analyzed ROAS to improve their ad strategy. As a result, we raised $233,699 in the first 24 hours of their campaign.
Here are two different advertisements we used to drive their reservation funnel during prelaunch. The copy and audience were identical, but you can see that the imagery is different.
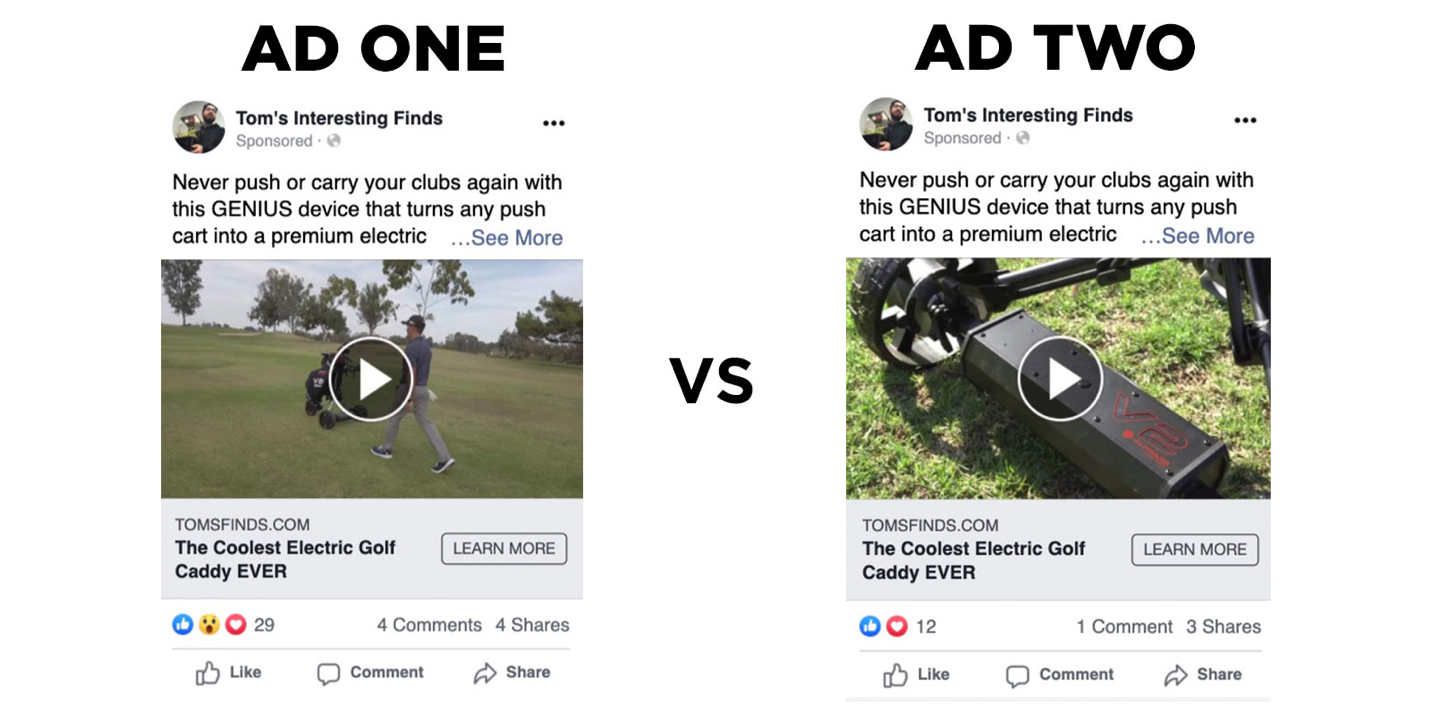
The ad spend for #1 was $112.99. It collected sixty leads, and thirteen of those put down a $1 deposit and became VIPs.
We spent $46.15 on ad #2, collected twenty-two leads, and one of those leads put down a $1 deposit to become a VIP.
| SCENARIO 1 | SCENARIO 2 | |||
| Expected Returns | Expected Returns | |||
| Deposit Revenue | $13.00 | Deposit Revenue | $1.00 | |
| VIP Revenue | $2,193.75 | VIP Revenue | $168.75 | |
| Non-VIP Revenue | $264.38 | Non-VIP Revenue | $118.13 | |
| Total Revenue | $2,471.13 | Total Revenue | $287.88 | |
| Return On Ad Spend (ROAS) | 2187.03% | Return On Ad Spend (ROAS) | 623.78% |
When we break down these two ads by expected ROAS, it’s easy to see that ad #1 has a higher likelihood to drive revenue than ad #2 does. We stopped testing ad #2, and continued to spend on ad #1.
Take all the ads you ran before and during your campaign. Using ROAS, systematically pit them against each other. What copy best highlighted the features of your product? What imagery best captured the viewer’s attention? What audiences resonated most with your product?
Afterwards, eliminate the ads that don’t work and keep refining and testing the ones that do. You’ll gain greater confidence in your positioning and messaging, and you’ll have the data to back it up.
Social media and web analytics
Post-campaign, you want a watertight marketing funnel. Social media and web analytics point you to where leaks are happening in your funnel.
Let’s look back at your prelaunch marketing. Here are two important crowdfunding performance metrics to analyze post-campaign:
- Click-through rate (CTR)
- Conversion rate (CR)
Click-through rate (CTR)
Click-through rate (CTR) helps you gauge how effective your ads are at capturing attention. effectiveness of your ads.
Here’s the definition of CTR:
CTR is the number of clicks that your ad receives divided by the number of times your ad is shown: clicks ÷ impressions = CTR. For example, if you had 5 clicks and 100 impressions, then your CTR would be 5%.
The higher the CTR, the more your audience finds your ads interesting, useful, and relevant.
Ads are the hook. They are often the first touchpoint someone has with your brand. So they need to grab viewers’ attention, make them click on your ad, and start them on the journey to convert into buyers.
Your target CTR should be at least 3%.
What does it mean if my CTR is below 3 percent?
That’s an easy answer: You aren’t grabbing people’s attention quickly enough.
Your ad’s creative is made up of these three parts, listed in order of highest to lowest impact:
- Imagery
- Copy
- Headline
Here’s an example from our Lomi campaign, which raised $7,228,029 on Indiegogo.
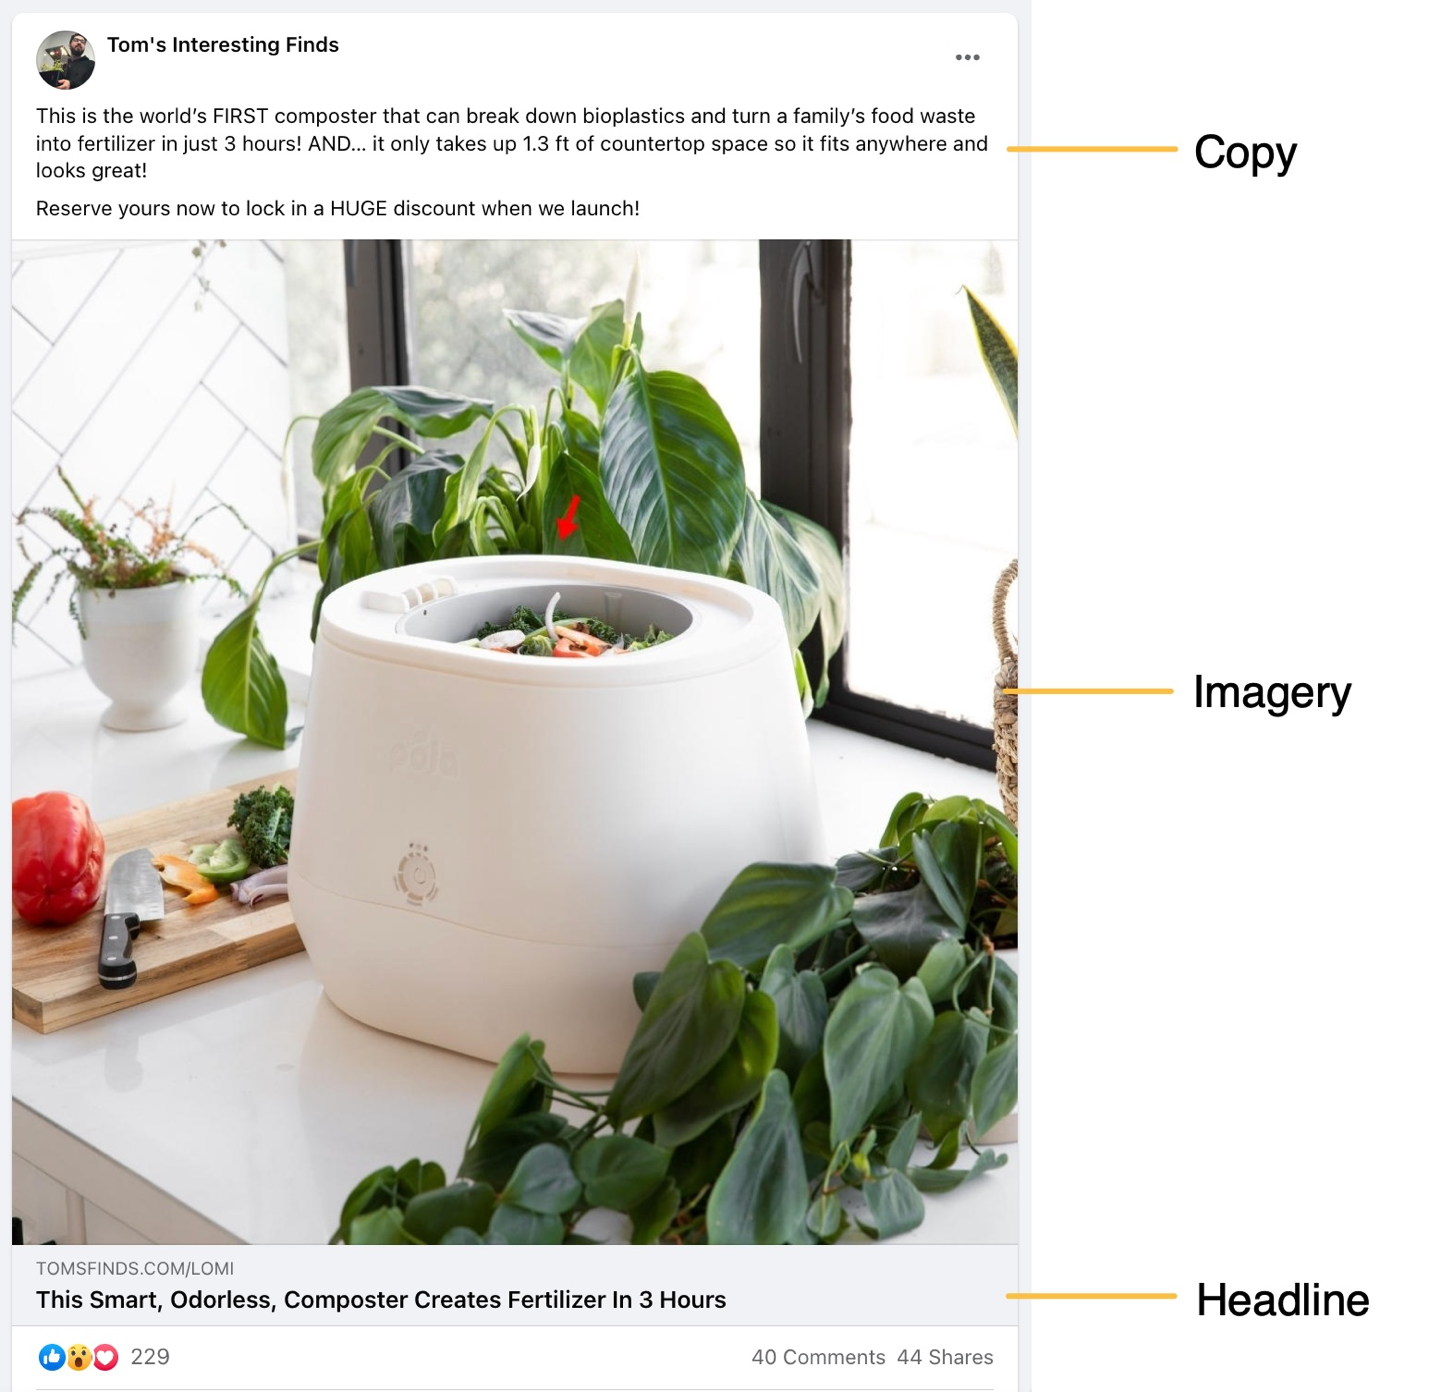
You can see that imagery is the most important because it’s where people’s eyes go first when they spot your ad. If you’re at or below 3% CTR, test your imagery first, and then your copy, and then your headline.
Conversion rate (CR)
Here’s what Mailchimp says about conversion:
Conversion rate (CR) measures the number of users who converted as a percentage of the total number of users that visited your site. The higher your conversion rate, the more effective your content.
Conversion is in response to a call to action. For example, the call to action of your prelaunch landing page is for visitors to sign up for your email list.
Here’s your goal: to collect an email address (lead).
Key metric: Conversion rate (CR)
Benchmark: 20% CR
That means we want at least 20 percent of all visitors to your landing page to become leads.
What does it mean if my CR is below 20 percent?
People don’t think your product is going to solve their problem.
You aren’t answering the question “Why should I want this product?”
As with ads, some components in your landing page hold more weight than others. From highest to lowest impact, they are:
- Headline
- Body text
- Image
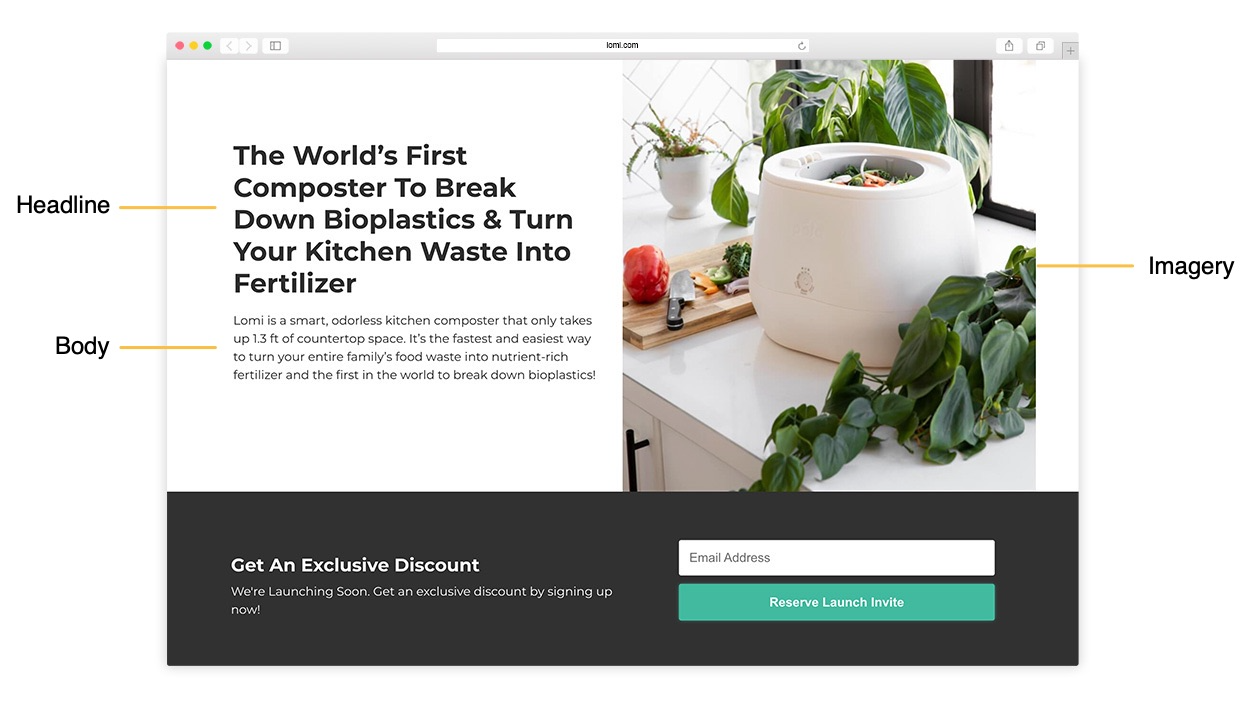
If the ad is the hook, the landing page the meat – it satiates your audience’s curiosity by answering why your product will solve a particular problem.
If your CR is below 20%, revisit your headline, and then your copy, and then your imagery.
Use CTR and CR to pinpoint the strengths and weaknesses of your marketing funnel. Include them in your post-campaign analytics, and you’ll put your best foot forward in developing a long-term brand.
Final thoughts
By now, we know that crowdfunding success isn’t as simple as saying, “I need to raise X number of dollars on my crowdfunding campaign.” Post-campaign analytics involves a ton of moving parts. But when pay attention to these key metrics, you uncover a wealth of information and insight into your brand.
Today, we explored:
- How to analyze backer data and demographics to understand your core audience
- How to use crowdfunding ROI and ROAS to refine your strategy
- How to measure CTR and CR in your social media and web content
Post-campaign analytics: Frequently Asked Questions
What tools are best for tracking post-crowdfunding metrics?
Google Analytics is a powerful and accessible tool for tracking marketing channels, visitor activity, and revenue sources. Backer surveys enable you to analyze backer demographics while gathering more subjective and open-ended feedback on your product.
How can I use backer analytics to improve future campaigns?
Backer analytics helps you systematically test your marketing content and isolate your most compelling headlines, copy, and imagery. By the next campaign, you’ll have a much better sense of what works and what doesn’t, and you’ll be much better at optimizing your ad spend.
What do crowdfunding success metrics tell us about campaign performance?
Crowdfunding success metrics tell you which marketing channels are contributing most to your campaign performance. Compare return on ad spend (ROAS) between marketing channels to determine which strategies are most effective. Use click-through rate (CTR) and conversion rate (CR) to identify and fix leaks in your marketing funnel.
How often should I review post-campaign analytics for optimal insights?
You should be systematically reviewing performance analytics at every turn. The key metrics we discussed today should be used to flesh out future product ideas and test ideas against each other. Post-campaign analytics will not only help you scale; it will help with the next product launch and the next until you’re on your way to developing a successful brand.