In the early days of LaunchBoom, clients would have to make major financial commitments to work with us, which meant big risk for both sides. No matter what the product, our job was to try and make it work. But after noticing patterns emerge from the product launches that failed, we became committed to finding out why.
What we found was that analytics are the unsung hero when it comes to pre-launch projections for how a crowdfunding campaign might turn out. How do we find this data? We find it through testing. Once we discovered the important role of analytics in predicting crowdfunding success, we preach that this part of the campaign is where people should spend the most time.
The pre-launch is the foundation of a successful campaign in determining cost and success. Let’s take a closer look at the pre-launch analytics you’ll need to hit in order to predict the outcome of your crowdfunding campaign.
Contents
- Key takeaways
- What is analytics in the crowdfunding context?
- What are the metrics for crowdfunding campaign success?
- Sources of analytics for a crowdfunding campaign
- How to combine data sources to predict crowdfunding success
- Final thoughts on the role of analytics in predicting crowdfunding success
- The role of analytics in predicting crowdfunding success: Frequently asked questions
Key takeaways
- Learning the key metrics that can indicate success as early as pre-launch
- Understanding the difference between quantitative and qualitative data in the context of crowdfunding campaigns
- Combining the most important data points to predict crowdfunding success
What is analytics in the crowdfunding context?

Before listing the different metrics you’ll need to measure in the pre-launch process, it’s important to first define what analytics are in the context of crowdfunding. When it comes to crowdfunding, analytics all start with product positioning.
The main thing your pre-launch analytics will tell you is how effectively you’re positioning your product to potential backers. When you aren’t getting the metrics you want, it’s the signal to spend more time either developing product positioning or the product itself.
When building the foundation of product positioning to produce favorable metrics, it helps to approach it using the framework of the Consumer-Based Brand Equity (CBBE) pyramid. Here’s what the CBBE pyramid looks like:
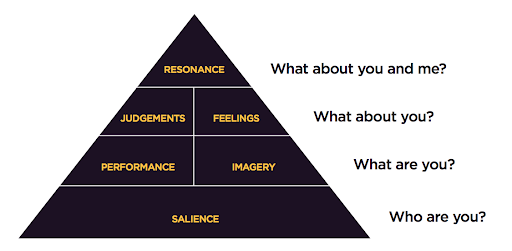
Filling out this questionnaire is the first step in developing good product positioning, because it helps to get to the underlying value that sets your product apart from the competition. When you have a strong grasp on your product’s value proposition, you can start to build messaging around that.
All of the messaging you can think of — whether it’s great, average, or seemingly off the mark — can then be tested in the pre-launch phase. Testing things like ad headlines, imagery, and benefits will tell you which parts of your product positioning are working best. These metrics will then give you a clear picture of whether your campaign will succeed or not.
But which metrics are the most important for crowdfunding success? Let’s break down the most relevant analytics.
What are the metrics for crowdfunding campaign success?
In pre-launch, the LaunchBoom system hinges on something called a reservation funnel. This funnel is how you are going to collect data. The reservation funnel consists of three main components:
- Landing page
- Reservation page
- Reservation checkout
Using Meta ads as the entryway into the funnel, prospective backers are then brought in to make a reservation for your crowdfunding launch. The key data to measure comes in two forms: quantitative and qualitative.
- Quantitative metrics are measurable data sets that offer an objective look at performance. These numbers are the guides for data-driven crowdfunding success.
- Qualitative metrics are things that aren’t as quantifiable, such as feedback from potential backers on social media or in emails. While not as key to forecasting crowdfunding success, qualitative data plays an important role in helping you make subtle adjustments that can pay off down the road.
With these terms in mind, it’s time to take a closer look at the key performance indicators to watch when predicting crowdfunding success.
Key performance indicators (KPIs) to watch
The best way to know if your campaign has a good chance at succeeding is if you know you can acquire customers profitably. The KPI that can indicate this is what we call Expected Return on Ad Spend (eROAS). This metric takes other data from your pre-launch reservation funnel process and predicts what your return on ad spend will be. The benchmark eROAS you want to hit is 2x or greater to know if your product has been properly validated.
Before being able to calculate eROAS, though, there are other important metrics to be mindful of throughout the reservation funnel process.
- Click-through rate (CTR): When designing your digital ads, the goal is to get people to click. You want at least 3% of people to click the ad and end up on your landing page.
- Conversion rate (CR): Ultimately, you want people who enter your funnel to convert into leads for your campaign. Aim for a 20% CR and make adjustments to the headline, body text, and image used on the landing page when optimizing for this metric.
- Lead-to-reservation rate (LTR): The final stage for leads in the reservation funnel is for them to put down a financial commitment for a chance at the best price come launch day. 4% LTR is the target for this metric. Inability to get to this benchmark could be an indication that your product is too expensive, or you need a lower discount incentive.
- Cost per reservation (CPR): CPR is how much it costs out of your ad spend to get a reservation to your campaign from a lead. The number to aim for is a CPR that is no more than 25% of the product’s price point with a maximum CPR of $50.
After your pre-launch reservation funnel has been running for a while and you’ve gathered sufficient data, you’re ready to calculate your eROAS. For a look at our simplified eROAS calculator, click here and give it a try.
Financial metrics: Beyond the funding goal
Other quantitative metrics to be mindful of relate to financial planning. In crowdfunding, setting the right funding goal is essential for effective financial planning. When you’re able to calculate exactly how much you’ll need to manufacture and ship your first batch of product, it allows you to budget your spending throughout the process much more tightly.
Margins will be tight; this is an often overlooked reality of crowdfunding. For example, here are some of the common costs associated with a campaign:
- 10% paid to the crowdfunding platform
- 10% paid to a crowdfunding agency (if you worked with one)
- A percentage lost from any discounts offered to backers
- Setup costs for things like a campaign video, graphic design, PR, etc.
Knowing that these costs are coming lets you better prepare for how much spending you’ll need to do. Additionally, you’ll want to know these key metrics for post-campaign product fulfillment:
- Cost to produce your product
- Cost to ship your product
Analyzing all of the costs associated with a crowdfunding campaign will help you set the right funding goal, which is instrumental to achieving success.
Engagement metrics: The power of social proof
Social media is another powerful source of KPIs, both quantitative and qualitative. The quantitative metrics to measure here are things such as likes, comments, and shares. This data is countable, and tells you how much engagement you’re getting for your product and campaign.
People who are on the fence about supporting your product but see how many people are engaging with your social media channels have a greater chance of getting swayed to back your product due to the social proof they see firsthand.
As for qualitative engagement metrics, these come in the form of what people say and how you respond to them. If people suggest changes they want to see that you hadn’t thought of before, you can think about implementing them. If people have comments, feedback, or questions, it’s then up to you to be responsive and show great customer service in the process. This pays dividends in the future by showing that you care about your backers.
Sources of analytics for a crowdfunding campaign
There are several sources of analytics to monitor when running a crowdfunding campaign. Some have been discussed already, like the analytics derived from the reservation funnel process and the engagement made through various social channels and email. Now, let’s look at some of the third-party analytics tools that can shed light on campaign performance.
Third-party analytics services: Enhancing data analysis
There are a couple of third-party analytics tools that play a vital role in determining crowdfunding success. The first of those is Google Analytics.
Google Analytics provides a bounty of data that can help you maximize your campaign. Here’s a brief list of relevant metrics to help in the crowdfunding process:
- Engagement rates: Google can track the percentage of visitors who interact with a web page in some way, as well as average engagement time and pageviews. These data points can help paint a picture of how exactly users are engaging with your content, and where on your main pages you can try to find improvement.
- Types of traffic: Traffic gets categorized into a few different categories, including organic, direct, referral and social. Knowing the types of traffic tells you exactly where you’re getting engagement from and where outreach efforts can be improved.
- CTR: On your various pages in the reservation funnel, you will have various call-to-action buttons that you want users to click on. Google Analytics lets you track exactly which ones are getting the most CTR, helping you optimize your pages to fit this trend.
The other powerful third-party analytics tool is Meta Pixel. Formerly Facebook Pixel, this service helps creators measure the effectiveness of ads on Facebook and Instagram. Knowing how ads perform allows creators to test more effectively, try different strategies, and make better decisions on creative assets.
Meta Pixel plays a pivotal role in the pre-launch process, but can also make all the difference when a campaign is live thanks to platform integration.
In-platform analytics tools and their insights
Crowdfunding platforms come with some useful features that make use of the same third-party analytics tools that we’ve previously discussed.
Kickstarter used to have a major disadvantage to Indiegogo, in that they did not have Meta Pixel integration with their platform. This made it difficult to track important metrics when campaigns were active, which hindered creators’ abilities to make the most informed decisions possible. That has since changed.
When a campaign is live, you’ll still be dependent on digital ads to continue to drive new traffic to your campaign page. You can add Meta Pixel before going live on whichever platform you choose, so be sure to get it set up ahead of time.
Similarly, Google Analytics can be integrated with your crowdfunding platform to track all of the data on a live campaign page. Here’s an example of how close of a look Google Analytics can give you about a specific aspect of a crowdfunding campaign:
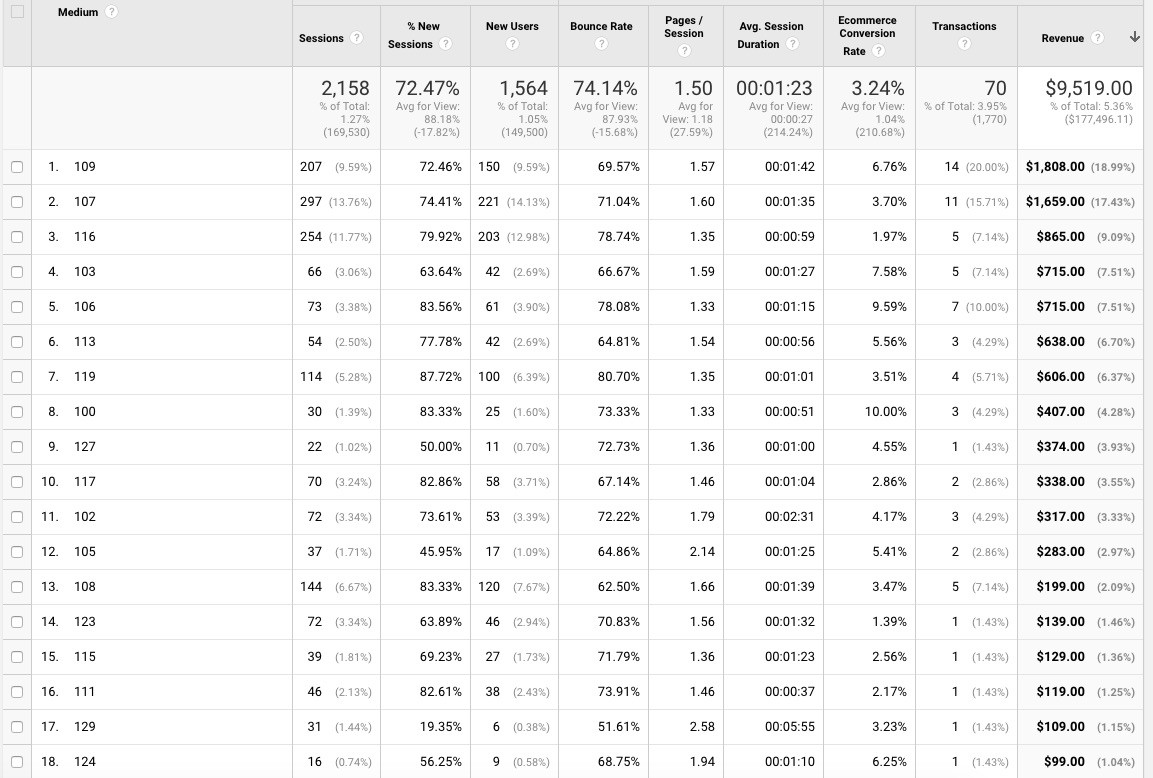
The above chart is from a campaign where the creator wanted to isolate the earnings generated based on a cross-promotion with another project. While ultimately not vital to the success of the campaign, this overview of a very specific data set gives insight into what kind of cross-promotion might be most effective in future crowdfunding endeavors.
Surveys and feedback: Qualitative data for success prediction
Surveys and real-time feedback play a key role in campaign success. Not only are they a great way to stay engaged with backers, they can lead to insights into what people are hoping to get out of your campaign.
For example, if you run a post-campaign survey and find out that people were hoping to get certain colors of a product, or certain add-ons to go with their product, you can take that information and apply it to future campaigns. These opportunities to upsell for more funding can lead to bigger gains in the future and help to further establish your brand as one that listens to the feedback of its fans.
How to combine data sources to predict crowdfunding success

To reiterate: Launches are won in the pre-launch. Once you’ve done all the necessary steps and gathered the right analytics, it’s time to combine all of the data sources to predict crowdfunding success.
The first thing to consider is eROAS. If you haven’t achieved the recommended benchmark of at least 2x eROAS, it is very much worth considering not going through with the launch. The mantra here is to fail early and fail cheap. It is much more expensive to fail once a campaign has finished than it is to not go through with the campaign at all having only spent money mostly on pre-launch ad spend.
If you have the greenlight from a positive eROAS, it’s time to use the analytics from your best performing ads. By now, you have the numbers to prove which collateral, from copy, to gifs, to images, resonate the best with your target audience. The goal is to repurpose these assets as much as possible for the campaign page.
A crowdfunding campaign page must be well designed. This is the first thing people are going to see when they arrive at your campaign. Consider using your best performing headline at the top of the page, your best performing product photo, and your best product description to live in the hero section. Most importantly, remember to trust the numbers and not your personal preference.
And if you’ve noticed on social media or email that people are interested in the possibility of certain add-ons, take the time to check with your manufacturer to see if they can accommodate for a good price. A common tactic is to use leftover raw material that will be generated from manufacturing your product to create a complimentary add-on that fans of your campaign would be willing to spend more money on.
Finally, don’t forget to take stock of post-campaign analytics. There is a lot of value to take away from zooming out once the campaign is over and digging into the numbers gathered across the full duration of the project.
Final thoughts on the role of analytics in predicting crowdfunding success
At LaunchBoom, we strive everyday to preach the importance of data-driven crowdfunding to creators who are new to the space. So many people have felt like they intuitively knew what was best for a campaign, only to find out the hard way that their gut feelings didn’t translate to success.
Now that you have a primer for the role of analytics in predicting crowdfunding success, we encourage you to apply it to your upcoming campaign. As long as you’re still in the pre-launch phase, it’s not too late to integrate this data-driven approach.
If you’re feeling a bit overwhelmed, we understand. Crunching numbers is not everybody’s cup of tea. For a chance to chat with a member of the LaunchBoom team, click here to set up a call. We’re ready to help no matter where you are on your crowdfunding journey.
The role of analytics in predicting crowdfunding success: Frequently asked questions
What are the determinants of crowdfunding success?
There are many determinants, but it really starts with product positioning. If your product does not resonate with your ideal target audience, the campaign won’t have a strong foundation for success.
Can analytics predict the failure of a crowdfunding campaign?
Analytics — while never 100% — can do a good job of predicting the outcome of a crowdfunding campaign. If certain metrics discussed in this post aren’t reached in the pre-launch process, it’s a good indication that the campaign might fall short of your funding goal.
How often should I check my crowdfunding analytics?
Checking analytics is important at every stage of your crowdfunding journey, but which metrics you look at will change. In the pre-launch, check your cost per reservation, cost per lead, and eROAS. During the campaign and post-campaign, check your cost to acquire a customer and return on ad spend (ROAS).
Are there free tools available for crowdfunding analytics?
Free tools include Meta Pixel, Google Analytics, Kickstarter / Indiegogo analytics, and the data available through your free social media platforms.