We’ve spent tens of millions building prelaunch email lists for clients. It’s the most important part of a successful launch. Because of this, I’m always asked the question:
“How do I know if my prelaunch ad is good?”
Well, I’ll be answering that question today…
Let’s say you’ve come up with your initial product positioning. You’re ready to test multiple angles and audiences. You have your ad copy written. You have your ad images created. You’ve programmed everything into Facebook and turned on your ads…
Now what?
There are hundreds of metrics that Facebook reports to you about your ad – click through rate, impressions, CPM, cost per lead… to name a few. Which metrics should you be looking at to measure success?
Understanding the Model
Although each metric can give you some insight, there are two that are most important for your pre-launch. Those metrics are:
- Cost per reservation – how much it costs to get a reservation. Note: we’ll track this metric using what Facebook calls “cost per purchase.” In our case, this is a slight misnomer since visitors aren’t really purchasing the product, but simply putting down a $1 deposit.
- Cost per lead – how much it costs to get a lead/email.
At the end of the day, an ad is successful if it makes you money. Since you are in pre-launch, you can’t directly track whether an ad will make you money or not. You can only make a prediction. These metrics allow you to make a more accurate prediction.
Before we get started, know that models are built using past data to try to predict the future. Unfortunately, no model is perfect. They only steer you towards the truth. With that said, let’s break down how this model works.
First, the leads you collect will go into one of two segments:
- VIPs – those that reserve by putting down a $1 deposit.
- Non-VIPs – those that give their email, but do not put down a $1 deposit.
Only a certain percentage of VIPs and Non-VIPs will buy your product when you launch. That percentage is called the conversion rate. We can assume that the VIPs will have a higher conversion rate than Non-VIPs. That’s because the VIPs showed more purchase-intent by putting down a $1 deposit.
If you know how many leads you have (both VIPs and Non-VIPs) and the expected conversion rate for both segments, you can calculate your expected sales.
For example, let’s say you have 100 VIPs and 900 Non-VIPs. Your expected conversion rate for the VIPs is 30%. Your expected conversion rate for the Non-VIPs is 1%. Now, it’s simple multiplication to calculate the expected number of sales.
- VIPs: 100 * 30% = 30 expected sales
- Non-VIPs: 900 * 1% = 9 expected sales
Okay, we’re getting closer to calculating expected revenue. The last step is to multiply your expected sales by your expected average order value. Average order value is the total revenue divided by the total orders over a certain time period.
Here’s how I calculate the expected average order value for the model. By looking over data from our past campaigns, I’ve found that the average order value is around 1.25x the lowest price point of the product. So, you can take your launch day price and multiply it by 1.25 to get your expected average order value.
Why are we using expected average order value instead of the price of a single unit? Well, when you launch your campaign, there will be a portion of your leads who purchase more than one unit. Because of this, your average order value will be higher than the price of a single unit – which is why it should be used in this calculation.
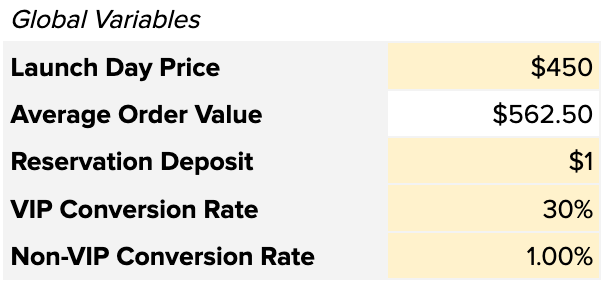
With all that explained, here’s an example of calculating your expected average order value. Let’s say your lowest price point is $450. Multiply that by 1.25 and you’ll get $562.50 – that’d be your expected average order value.
With the number of expected sales from each segment and the expected average order value, you can now calculate the expected total revenue.
- VIPs: 30 sales * $562.50 = $16,875.00 expected revenue
- Non-VIPs: 9 sales * $562.50 = $5,062.50 expected revenue
That would put your total expected revenue at $21,937.50 ($16,875.00 + $5,062.50).
Okay, we’re almost done, I promise!
The last step is to divide the total expected revenue by the amount you spent on advertising. This will give you the expected return on ad spend.
For example, let’s say you spent $5,000 on advertising. The equation would look like this:
$21,937.50 / $5,000.00 = $4.39
This means that for every dollar you spent, you made $4.39. Not too shabby.
A real life example
Let’s look at data from the pre-launch advertising for our client, eWheels V2. We did a lot of testing for eWheels V2, which is part of the reason why we raised $233,699 in the first 24 hours of the campaign.
We’re going to take a look at two different advertisements from the pre-launch. The only variable being tested was the imagery. That means the copy and audiences were identical. By isolating one variable, we are able to more accurately measure how that one variable affects the metrics.
Here are the two ads:
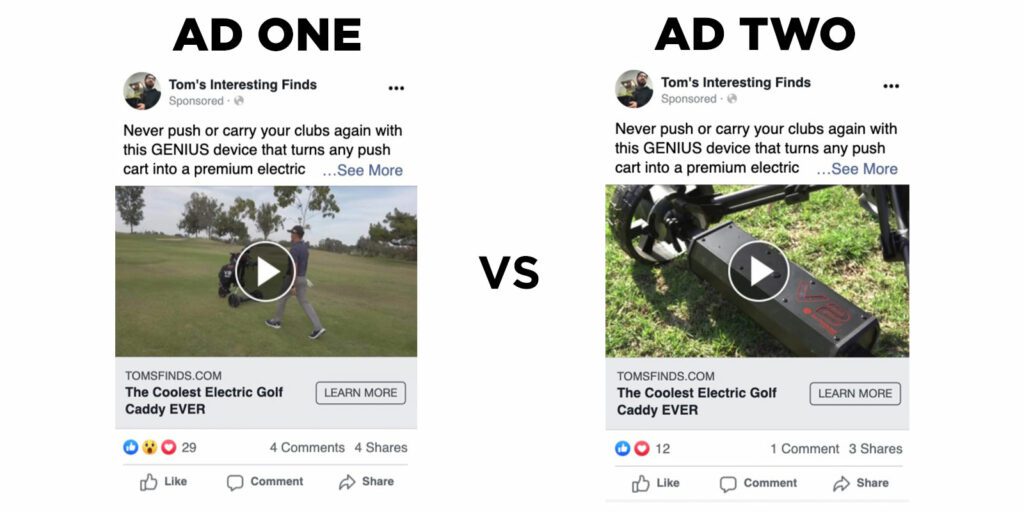
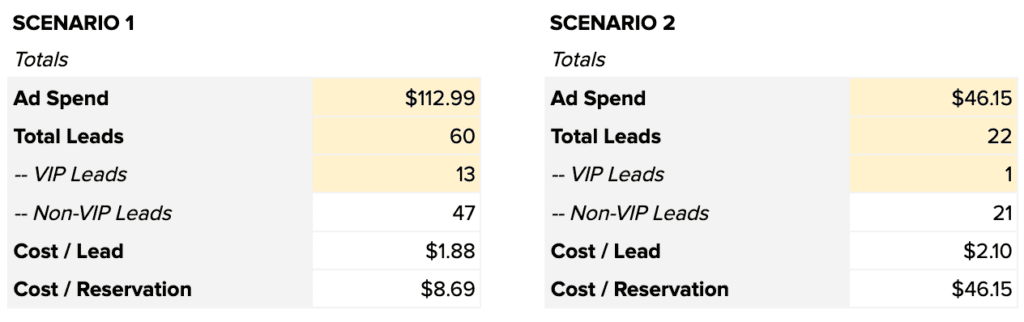
Ad one spent $112.99, collected 60 leads, and 13 of those leads put down a $1 deposit and became VIPs.
Ad two spent $46.15, collected 22 leads, and 1 of those leads put down a $1 deposit and became a VIP.
Let’s plug these numbers into the model. First, let’s start with the global variables, which are the variables that apply to both ads:
Next, let’s put in the ad metrics to see our cost per lead and cost per reservation:
Lastly, let’s see what our expected returns are:
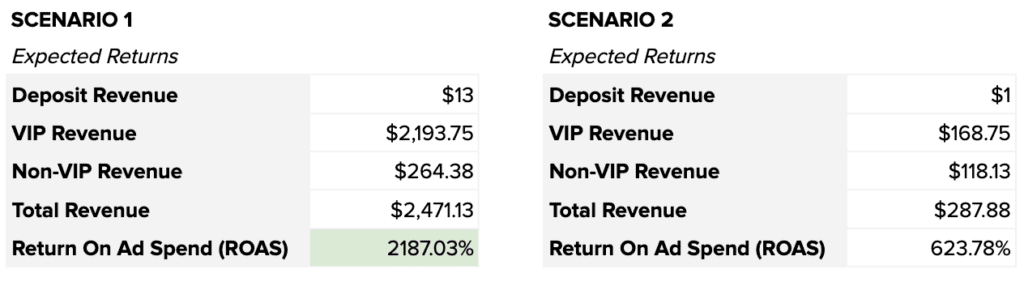
Based on this model, it’s easy to see that ad one has a higher likelihood to drive revenue than ad two. That is why we stopped ad two and continued to spend on ad one.
Applying The Model To Your Ads
Now that you understand how the model works, you can apply it to your own advertising tests. Test copy that details different features of your product. Test imagery that captures attention. Test different audiences to see who really resonates with your product.
Take all the data you collect and plug it into the model to see which ad has a higher likelihood of driving more revenue. Keep the ad that won running. Stop the ad that lost. Create a new test. Rinse and repeat.
This is how you systematically test your positioning. Now when you launch, you will be confident in your ability to convey the value of your product to the right audience. You have data to back it up.
Furthermore, you now have a pre-launch email list of people that you know are qualified because the data shows you they are. A list of people that want to buy your product. A list of people that will get you funded the first day.